"...are any on these anti-global warming points at all valid?"
Answer: No. Every single one is wrong. We can take them one at a time.
"1. Temperature records from around the world do not support the assumption that today’s temperatures are unusual."
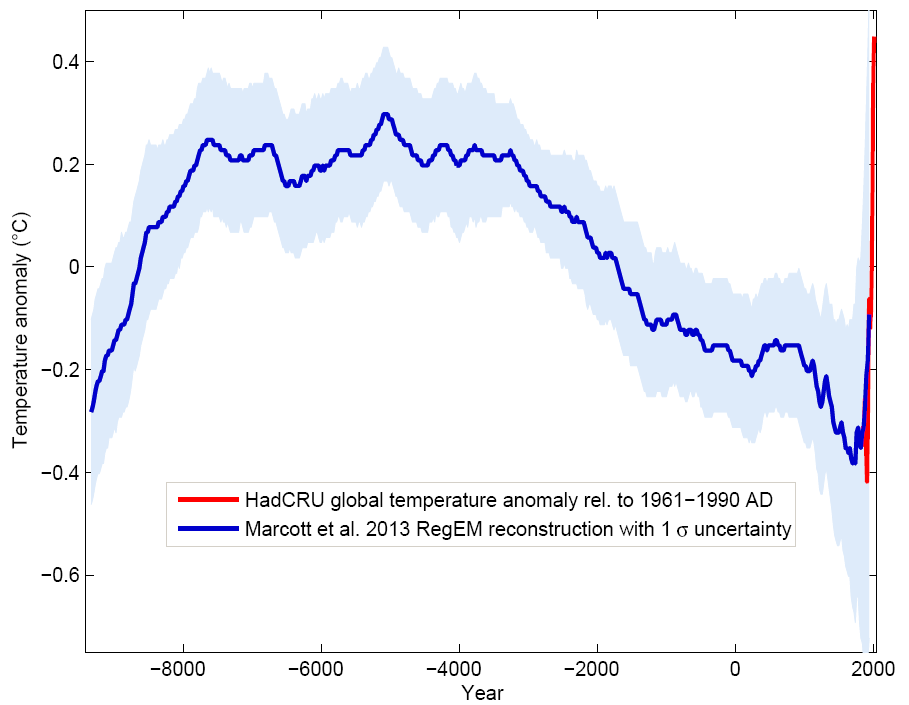
A: Wrong. The Marcott reconstruction probably makes the point best; it also shows the extraordinary recent acceleration. Temps today are almost certainly higher than the Holocene Climate Optimum ~6-8K yrs ago, which means they're the highest since the Eemian ~120K years ago (when the Milankovitch cycles made it warmer than now).
http://www.realclimate.org/index.php/archives/2013/09/paleoclimate-the-end-of-the-holocene/
http://www.realclimate.org/images//Marcott.png
"2. Satellite temperature data does [sic] not support the assumption that temperatures are rising rapidly..."
A: Evidently this "former professor" can't speak English. He's also dead wrong. Yes, there was a very strong El Niño in 1997-98 with a lot of warming. But the 2015-16 EN was almost as strong, & 2016 has been very warm on both main satellite datasets (UAH & RSS), significantly warmer than 1998. The RSS dataset was also adjusted upward to show more warming when orbital decay was factored in. This link even includes a vid of Carl Mears, who puts the RSS data together, where he says flat-out that the surface data are more accurate.
http://www.carbonbrief.org/explainer-how-surface-and-satellite-temperature-records-compare?utm_content=bufferde258&utm_medium=social&utm_source=twitter.com&utm_campaign=buffer
Quoting, "The trend in the satellite data is 0.11C per decade since 1979, compared to 0.16C per decade in the surface record."
Spencer's UAH dataset shows clear warming, with the recent EN causing warmer temps than the 1998 event. That's despite his HUGE v6 adjustment that subtracts almost 0.2° C of warming since 2000 (roughly 10 times the size of the Karl et al NOAA data warming adjustments that put Congress in a tizzy in the summer of 2015).
http://www.drroyspencer.com/latest-global-temperatures/
https://moyhu.blogspot.com/2015/12/big-uah-adjustments.html
It's also important to remember that the main two satellite datasets significantly understate warming. They can be compared to the RATPAC radiosonde data, where actual thermometers are placed on actual balloons to measure actual temperatures of actual air.
The result? The satellites understate warming.
https://tamino.wordpress.com/2016/04/02/new-rss-and-balloons/
"3. Current temperatures are always compared to the temperatures of the 1980’s, but for many parts of the world the 1980’s was the coldest decade of the last 100+ years..."
A: Wrong, wrong & wrong. Current temps are compared to the entire thermometer record, & thru proxies, to much earlier times. And you CAN'T SAY "MANY PARTS OF THE WORLD"!!! You can't cherry pick certain areas & say they haven't warmed.
The 1930s were warm in the US. So what? Even now, Iceland & southern Greenland are cooler than they were a century ago, but that's because of ICE MELTING & is HORRENDOUS news. You don't get to cherry-pick certain areas if you're an honest scientist; your professor is not an honest scientist.
"4. The world experienced a significant cooling trend between 1940 and 1980..."
F: Not exactly. There was a strong El Niño in 1942, & 1943 was very warm. Following that, we had slight cooling till around 1977.
http://data.giss.nasa.gov/gistemp/graphs_v3/
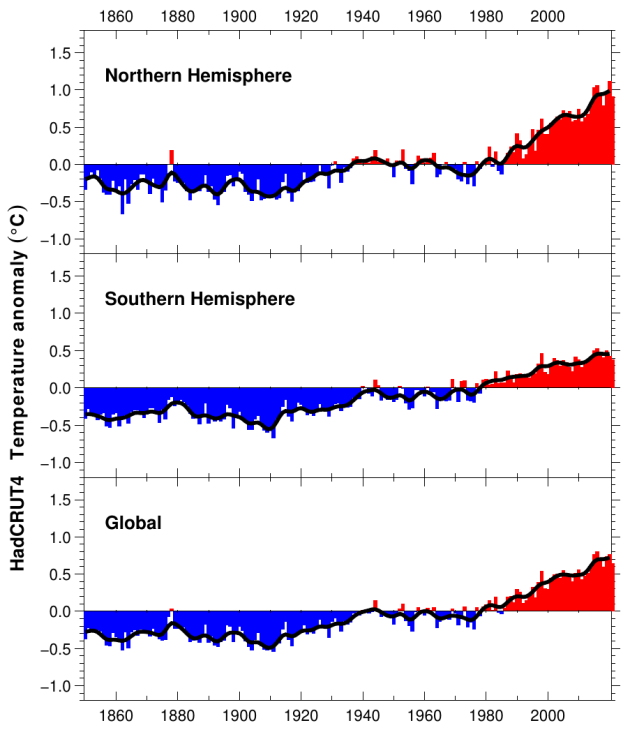
We had more pronounced cooling from ~1879-1911 (the 1879 date is uncertain give sparse data at the time). These are the only statistically significant, prolonged "pauses" in warming in the temperature record. It is UTTERLY HILARIOUS that deniers call the ~1999-2013 slowdown in warming "THE" pause!!!!! Statistically, it didn't exist; it wasn't long or pronounced enough to reach statistical significance.
https://crudata.uea.ac.uk/cru/data/temperature/HadCRUT4.png
The causes of these periods are not mysterious. When the oceanic cycles are negative, La Niñas predominate & we "normally" get cooling. When these cycles are positive, El Niños predominate & we get warming.
The PDO (Pacific Decadal Oscillation) is probably referenced more often, but it was originally detected in patterns of salmon catches & its focus is the northern Pacific. The IPO (Interdecadal Pacific Oscillation) references the whole Pacific, so it more accurately reflects these changes.
http://www.nature.com/nclimate/journal/v4/n10/full/nclimate2341.html
http://iopscience.iop.org/article/10.1088/1748-9326/10/8/084002;jsessionid=C040B56251C251FB11D142FF3B602B4D.c2.iopscience.cld.iop.org
If you look at the record, these cycles used to be ~30-33 years long. The POINT is that the ~1977-1998 warming cycle was only ~22 years long, & the ~1999-2013 slowdown was only ~15 years long. The latter reflected the fact that CO2-induced warming is now SO strong that we got NO COOLING AT ALL, just slower warming. (Each cooling cycle in the record has shown slower cooling, while each warming cycle has shown faster warming.) These shorter cycles may be one of the reflections of the profound disturbance ACC is already having on our world.
"5. Urban heat island effect skews the temperature data of a significant number of weather stations..."
A: Wrong. This has been evaluated extensively by multiple independent groups. In fact, the Berkeley Earth project was formed partly to address this question. They tried very hard to find errors by NASA but ended up affirming NASA's results & extending them to the mid-1700s, not to mention saying humans were responsible for 99+% of the warming since then. All of their data & analyses are available at their website
http://www.scientificamerican.com/article/converted-contrarian-argues-humans-to-blame-for-climate-change/
http://berkeleyearth.org/
"6. There is a natural inverse relationship between global temperatures and atmospheric CO2 levels..."
A: Once again, your "pretty smart" professor shows he can't speak English; he evidently doesn't know the difference between inverse & converse. There is NOT an inverse relationship between temps & CO2!!!!! It's a positive relationship.
The fact is that warming raises CO2, AND higher CO2 causes warming. It's a positive feedback cycle. Higher CO2 causes warming, & the CONVERSE is also true.
If CO2 rises, so do temps. This causes further CO2 rise (e.g. from the oceans; warm water holds less CO2, as with a warm soda), which causes more warming until they reach semi-equilibrium. Warming from another cause (e.g. Milankovitch cycle changes at the start of an interglacial) causes CO2 to come out of the oceans, which then causes more warming.
"7. The CO2 cannot, from a scientific perspective, be the cause of significant global temperature changes..."
A: Wrong again. CO2 has been the principal control knob on temps over the entire Phanerozoic. The vid is of the respected Penn State climatologist Richard Alley from a few years ago; he's very watchable.
http://science.sciencemag.org/content/330/6002/356
http://www.geosociety.org/gsatoday/archive/14/3/pdf/i1052-5173-14-3-4.pdf
https://www.youtube.com/watch?v=RffPSrRpq_g
Your professor spouts a lot more nonsense about frequencies absorbed by CO2 & H2O. Water vapor is a feedback on CO2 because warm air holds more H2O, roughly doubling the effect of CO2. But it passes very quickly in & out of the atmosphere in precipitation or evaporation, while CO2 stays there for many millennia. That's why CO2 is a forcing on temps while H2O vapor is a feedback.
"8. There have been many periods during our recent history that a warmer climate was prevalent long before the industrial revolution..."
A: Nonsense. There is controversy about whether the MCA (Medieval Climate Anomaly) was warmer than the mid-20th century (~1950), but there is NO doubt that we're warmer now. This has been shown by multiple proxies, including tree rings, ice cores, sediments & speleothems. Look at my previous links, or at this:
http://ossfoundation.us/projects/environment/global-warming/myths/the-hockey-stick
"9. Glaciers have been melting for more than 150 years..."
A: More nonsense. Look no further than Glacier National Park, where they're vanishing virtually before our eyes.
http://video.nationalgeographic.com/video/news/151021-glacier-national-park-melting-vin
There is no doubt that we had cooling during the LIA (Little Ice Age). In fact, we were cooling for some 6K yrs before the Industrial Revolution (as my previous links have shown).
Consider Ötzi the Iceman, who was murdered & buried in snow ~5300 years ago. He thawed out in 1991. Why then? Because it was warmer in 1991 than it had been for ~5300 years! (OK, that's an over-simplification, but it makes some sense, doesn't it?)
https://en.wikipedia.org/wiki/%C3%96tzi
"10. 'Data adjustment' is used to continue the perception of global warming..."
A: Wrong yet again. In any dataset that includes sea surface temps (>70% of the Earth's surface; more than 90% of warming goes into the ocean, so global warming IS ocean warming), the biggest adjustment is ALWAYS to SSTs before 1940. That's when thermometers were moved to engine water intakes; before that, temps were taken by dropping buckets over the sides of ships, which were ~0.5-0.7° C cooler.
The biggest adjustment to these temps is to adjust pre-1940 water temps upward, & this ALWAYS shows less warming. Always.
If you want to understand it, watch this vid from Phil Jones of HadCRU. He's a bit soporific, but he's very, very knowledgeable.
https://www.youtube.com/watch?v=fuRU10ocuds
Your professor is lying thru his teeth. To be generous, he's probably lying to himself. But in any case, he's profoundly, desperately wrong, on every single point.
No comments:
Post a Comment